1) Where and when was born the idea of resorting to trees as a way to predict earthquakes ?
2) What kind of trees do you use ? Why these types ?
3) How do you choose the tree you fix the electrodes to ? Age, size of trees are they important ? season is important ?
4) How many electrodes do you fix on a tree and where do you fix ?
5) What signal do the electrodes record in the tree ?
6) How do you define Tree Electric Potential ? What is it caused by ?
7) What is the nature of the signal coming from the earthquake and felt by the tree ?
8) How can you explain the fluctuations, peaks, more or less regular, on the recording graph in normal time (no EQ) ?
9) From the graph, increasing the TBP begins two to three months before the earthquake. Can this rise be originated by something else that an earthquake ?
10) Can any earthquake whatever its magnitude be recorded the same way ?
11) Is-it possible know the magnitude and localisation of an EQ thanks to trees ?
12) As far as Fukushima events, did you expect anything of that magnitude (M9) thanks to your records on trees ?
13) Along which way do you continue your researches ? What remains to be done for TBP becomes a reliable and used throughout the world ?
14) To what extend is this approach superior to any other in the prediction of earthquakes ?
- Copyright: Dominique PADIRAC and Yoshiharu SAITO -
1) Where and when was born the idea of resorting to trees as a way to predict earthquakes ?
It was discovered in July 1977 at campus yard of Tokyo Woman's Christian University by Dr. Hideo TORIYAMA almost happening.
During he was measuring Tree Bio-electri Potential (TBP) for research of outdoor plant, he found very big variation in TBP, after 37 hours, an earthquake (EQ) occurred in Tokyo with magnitude 4.0. After then he found the same phenomina several times.
2) What kind of trees do you use ? Why these types ?
We use evergreen and broadleaf trees whose bark is smooth, rugged bark is not sutable. Trees with no resin. These kinds have small seasoning variation. Evergreen trees are preferable, but deciduous trees are also able to be used, because starch is consumed and water supplied through trunk and branch in winter season.
The following trees will do; Silk tree, zelkova tree, camellia, mulberry tree, fragrant olive, Dendropanx trifidus tree, and so on.
3) How do you choose the tree you fix the electrodes to ? Age, size of trees are they important ? season is important ?
Age is more than about 5 years, size of trunk or branch doesn’t care, smaller is easier to fix electrode, less than 5cm is better. You can fix electrode at any time in the year. Electrode on a tree is shown in Figure-1.
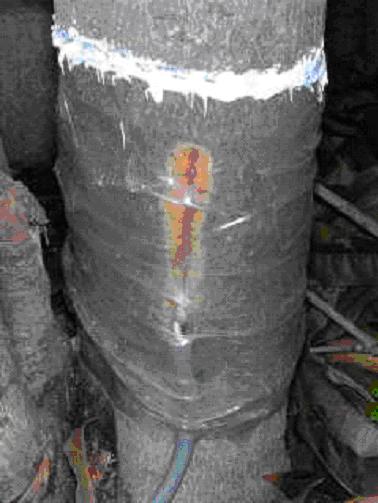
Figure-1 Electrode on a tree trunk
4) How many electrodes do you fix on a tree and where do you fix ?
One electrode is fixed on one Tree. To fix it on trunk generally but if diameter of the trunk is bigger than 5cm, we fix it on branch.
5) What signal do the electrodes record in the tree ?
Direct Current (DC) voltage between the electrode and Earth with range of about +/- 500mV. Earth electrode is made of copper bar as shown in Figure-2.

Figure-2 Copper Earth Bar in the ground
6) How do you define Tree Electric Potential ? What is it caused by ?
You can measure TBP by using DMM (Digital Multi Meter) in DC Range. We measure by Data Logger or Analog/Digital Converter and Data Processor. We lead it to PC (Personal Computer). The sampling time is 20mSecond (50 Times/Sec) and we take average in 20 Second.
Geo Potential (GP) previously generated by an EQ comes to root of tree, tree feels GP as stimulus, the stimulus makes tree to respond as exitation, this exitation generates electric potential in a cell of tree by electrolytic material such as Kalium (potassium, scientific code K), calcium (Ca), chlorine (Cl), etc.
7) What is the nature of the signal coming from the earthquake and felt by the tree ?
GP described above. GP is generated potential at received point caused by earth current or telluric current. There are several types of anomary, one was shown in the last E-Mail, the other type is Chrge-Discharge curve shown in Figure-3.

Figure-3 Chrge-Discharge curve
8) How can you explain the fluctuations, peaks, more or less regular, on the recording graph in normal time (no EQ) ?
I think fluctuations and peaks in normal time is mainly due to photosynthesis of plant.
9) From the graph, increasing the TBP begins two to three months before the earthquake. Can this rise be originated by something else that an earthquake ?
Dr. TORIYAMA says that somethig else may be followings; (1) Earth current or telluric current caused by Electric motor train shown in Figere-4 , (2) stimulus caused by physical shock such as cutting branch or hitting by baseball bat shown in Figere-5 , (3) stimulus caused by thunder shown in Figere-6 , (4) strong wind and Typoon shown in Figere-7 , (5) volcanic explosion shown in Figere-8 , and so on.
In case of (1), graph is quite calm during out of service time. In case of (2) to (5), anomary appears synchronized with each event and short term.
The incrasing TBP was synchronized with the EQ, and very calm for long time before then. Therefore, I judged the anomary was correlative with the EQ.

Figure-4 Electric Motor Train and Snow
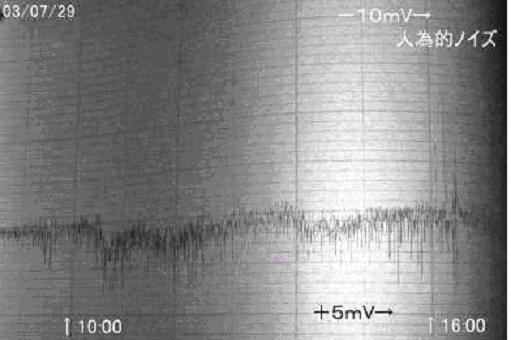
Figure-5 Cut Branch

Figure-6 Thunder
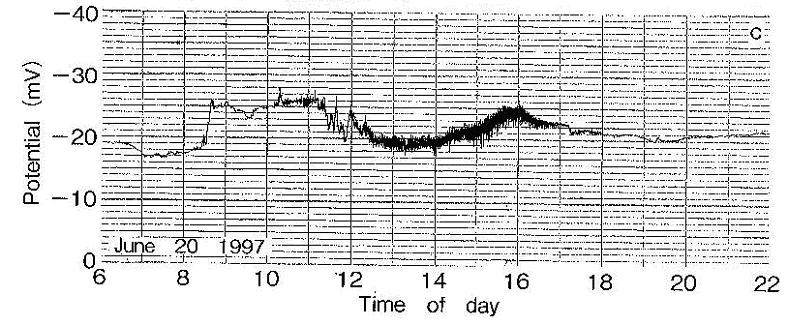
Figure-7 Typhoon

Figure-8 Volcanic Explosion
10) Can any earthquake whatever its magnitude be recorded the same way ?
Depence, sometimes apears nothing, there are sensitive trees and insensitive trees. But some stimulus may be felt prior to a big EQ.
11) Is-it possible know the magnitude and localisation of an EQ thanks to trees ?
I think it’s possible to know magnitude and location of an EQ in the future, if you observe TBP at many points.
I think trees can feel GP caused by EQ within 1,000km radius. Tendency of TBP anomary may be slanted at many plases. If you mark a circle on Map, overlaped place may be epicenter.
Magnitude is proportional to logarithm of energy which is identical to TBP voltage and inverse proportinal to square of distance between observation post and epicenter. Only coefficient for those parameter is unknown.
12) As far as Fukushima events, did you expect anything of that magnitude (M9) thanks to your records on trees ?
No, I inspected after the EQ. But, if I make automatic and real time graph drawing software for long term, it may be possible to know previously.
13) Along which way do you continue your researches ? What remains to be done for TBP becomes a reliable and used throughout the world ?
I would like to inclease numbers of observation posts in Japan. In addition with that, what remains are to reserch direction to epicenter. We are thinking to make experiment to put 4 or 6 electrodes on one tree as shown in Figure-9 and the same number of earth electrode to the same 4 or 6 directions.
To be used in the world, I will write papers and open to the public through Internet. Please help me to spread over the world.
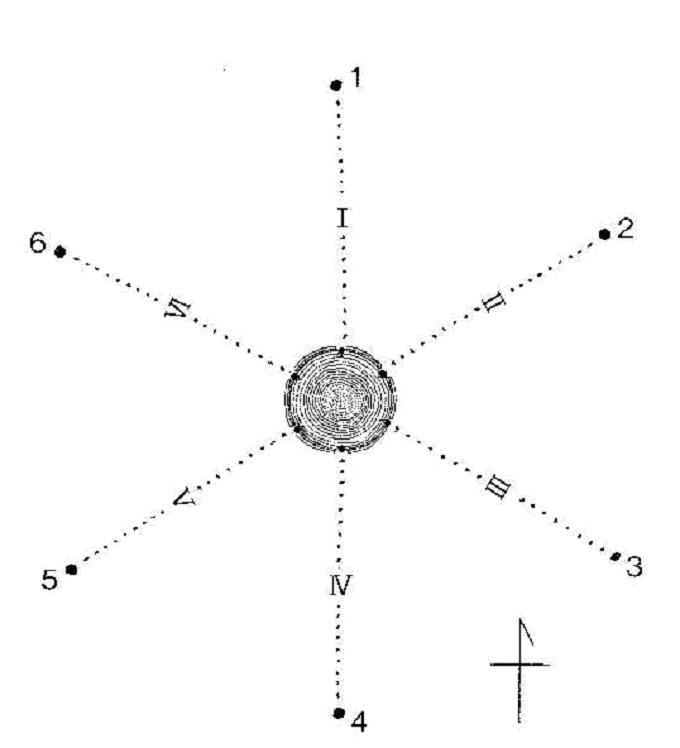
Figure-9 6 Direction Observation
14) To what extend is this approach superior to any other in the prediction of earthquakes ?
Animals are also sensitive for EQ precursor but difficult to measure something, but trees stay there at all the time, so very easy to measure something. TBP is easy to show numerically. Science should be numerical.
Superior point of this method is to apply instinct of creature, anywhere anybody can do it at low cost, you can recognize an EQ occurrence near from you in real time.
However, only one method is not enough to predict EQ ocurrence, it is important to judge it by observing several methods, i.e. MF, LF, VHF band electric and magnetic waves, too. When you find an anomary in one method, you have to judge comprehensively.